
Please refer to important disclosures at the end of this report
1
Incorporated in 1992, Newgen Software Technologies Limited (NSTL) is a
New
Delhi based IT company and
a global provider of Business Process Management
(BPM), Enterprise Content Management (ECM), Customer Communication
Management (CCM), Document Management System (DMS), Workflow and
Process Automation. NSTL has 450+ active customers, with clients spread over
60
countries. The company sells its products to banks, insurance firms, BPOs and
healthcare organizations. It has offices in the US, Canada, the United Kingdom,
Singapore, and Dubai.
Positives: (a) Diversified business across several verticals including
Banking,
Government/PSUs, BPO/IT, Insurance and Healthcare (b)
Diversified revenue
streams from multiple geographies with low customer concentration (c)
Recurring
and non-recurring repeat revenues from long standing customer relationships
(d)
Focused on driving innovation through in-house R&D.
Investment concerns: (a) NSTL was able to report only single digit bottom-
line
CAGR of ~8% despite a top-line CAGR ~20% over FY13-17, due to lack of
stability in operating margins (b) During 1HFY18, the company
has reported very
low margin and profitability (c) working capital days are very high
Outlook & Valuation: In terms of valuations, the pre-
issue P/E works out to 274x its
1HFY2018 annualized earnings (at the upper end of the issue price band), which is
higher compared to its peers like Intellect Design Arena (trading at PE 143x -
1HFY2018 annualized earnings).
Further last four years historical financial records
and 1HFY18 doesn’t provides confidence.
Hence, we recommend Neutral rating
on the issue.
Key Financials
Y/E March (` cr) FY2015 FY2016 FY2017 1HFY18
Net Sales 308 347 427 207
% chg 24.2 12.4 23.2 -
Net Profit 46 28 52 6
% chg 12.9 (40.0) 88.2 -
OPM (%) 18.7 11.3 16.4 4.6
EPS (Rs) 7.1 4.3 8.0 0.9
P/E (x) 34.5 57.6 30.6 -
P/BV (x) 7.6 7.0 5.8 -
RoE (%) 21.9 12.1 19.1 -
RoCE (%) 20.9 12.1 19.9 -
EV/Sales (x) 5.1 4.6 3.7 -
EV/EBITDA (x) 27.1 40.5 22.4 -
Angel Research; Note: Valuation ratios based on pre-issue outstanding shares and at upper end
of the price band
Neutral
Issue Open: Jan 16, 2018
Issue Close: Jan 18, 2018
QIBs 50% of issue
Non-Institutional 15% of issue
Retail 35% of issue
Promoters
66.3%
Others
33.7%
Post Issue Shareholding Pattern
Post Eq. Paid up Capital: `69.2cr
Issue size (amount): **`425
cr (Inculde offer
for sale -
`
330)
Price Band: `240-245
Lot Size: 61 shares and in multiple
thereafter
Post-issue implied mkt. cap: *`1,662cr -
**`1,696cr
Promoters holding Pre-Issue: 70.3
%
Promoters holding Post-Issue: 66.3
%
*Calculated on lower price band
** Calculated on upper price band
Book Building
Fresh issue: `95cr
Issue Details
Face Value:
`10
Present Eq. Paid up Capital: `65.4cr
Amarjeet S Maurya
+022 39357600, Extn: 6831
amarjeet.maurya@angelbroking.com
Newgen Software Technologies Ltd
IPO Note |
IT
Jan 12, 2018
Newgen Software Technologies Limited | IPO Note
Jan 12, 2018
2
Company background
Newgen Software Technologies Limited is an IT company, incorporated in 1992
with head quarter in New Delhi. Newgen Software is a global provider of Business
Process Management (BPM), Enterprise Content Management (ECM), Customer
Communication Management (CCM), Document Management System (DMS),
Workflow and Process Automation. Some of the biggest clients of the company are
TCS, HP and HCL.
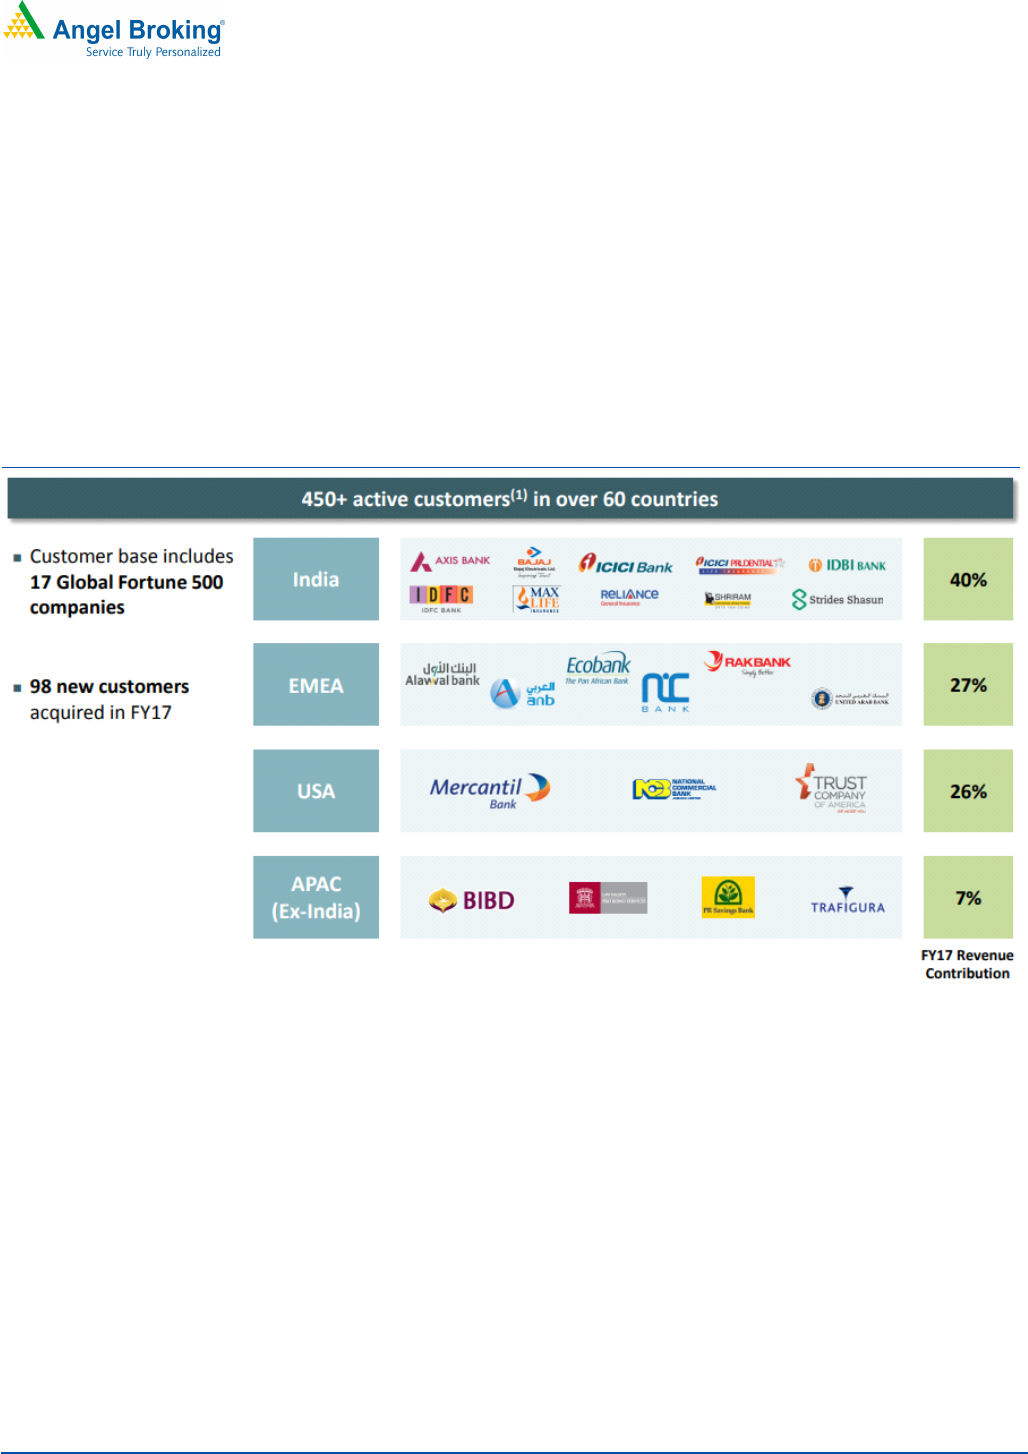
The firm currently sells its products across 60 countries. The company’s clients are
spread across banks, insurance firms, BPOs and healthcare organizations. It has
offices in the US, Canada, the United Kingdom, Singapore, and Dubai.
Exhibit 1: Diversified Global Customer Base
Source: Company, Angel Research

Newgen Software Technologies Limited | IPO Note
Jan 12, 2018
3
Issue details
NSTL’s IPO is a mix of Offer for sale and fresh issue. The issue would constitute
fresh issue worth of `95cr and Offer for sale worth of `330cr (at upper band). The
company will dilute 5.6% of its post-offer paid-up equity share capital.
Exhibit 2: Pre and Post-IPO shareholding pattern
No of shares (Pre-
issue)
%
No of shares (Post-
issue)
%
Promoters
45,928,938 70.3%
45,928,938 66.3
%
Others
19,429,212
29.7%
23,306,763 33.7%
65,358,15
0
100.0% 69,235,701 100.0%
Source: Source: RHP, Note: Calculated on upper price band
Objectives of the offer:
The objectives of the IPO for the Company are:
to purchase and furnish office premises near Noida-Greater Noida
Expressway, Uttar Pradesh; and
general corporate purposes
Outlook and Valuation:
In terms of valuations, the pre-issue P/E works out to 274x its 1HFY2018
annualized earnings (at the upper end of the issue price band), which is higher
compared to its peers like Intellect Design Arena (trading at PE 143x -1HFY2018
annualized earnings). Further last four years historical financial records and
1HFY18 doesn’t provides confidence. Hence, we recommend Neutral rating on the
issue.
Key Risk
The company may be subject to intellectual property infringement claims
by other companies which could materially increase costs & harm
company’s ability to generate future revenue & profits.
Increase in competition from other player can impact the business of
company.

Newgen Software Technologies Limited | IPO Note
Jan 12, 2018
4
Consolidated Income Statement
Y/E March (` cr) FY2014
FY2015 FY2016 FY2017
1HFY18
Total operating income 248
308 347
427
207
% chg 23.5
24.2 12.4 23.2
-
Total Expenditure 200
251 308
357
198
Raw Material 3
0 -
-
-
Personnel 116
143 183
210
118
Others Expenses 82
107 -124
147
80
EBITDA 48
58 39 70
10
% chg 6.2
20.3 (32.1) 78.3
-
(% of Net Sales) 19.3
18.7 11.3 16.4 4.6
Depreciation& Amortization
4
4 4 5 3
EBIT 44
53 35 65 7
% chg 7.3
20.1 (34.7) 86.8
-
(% of Net Sales) 17.9
17.3 10.1 15.3 3.3
Interest & other Charges 1
2 4 4 2
Other Income 7
8 3 7 3
(% of PBT) 13.5
13.1 8.4 9.9 35.3
Share in profit of Associates
-
- -
-
-
Recurring PBT 50
59 34 68 8
% chg 11.7
18.8 (42.0) 97.3
-
Tax 9
13 6 15 2
(% of PBT) 17.4
21.5 18.7 22.5 23.7
PAT (reported) 41
46 28 52 6
% chg 11.2
12.9 (40.0) 88.2
-
(% of Net Sales) 16.5
15.0 8.0 12.3 2.8
Basic EPS (`) 6.3
7.1 4.3 8.0 0.9
Fully Diluted EPS (`) 6.3
7.1 4.3 8.0 0.9
% chg 11.2
12.9 (40.0) 88.2
-
Source: RHP, Angel Research

Newgen Software Technologies Limited | IPO Note
Jan 12, 2018
5
Consolidated Balance Sheet
Y/E March (` cr) FY2014
FY2015
FY2016
FY2017
1HFY18
SOURCES OF FUNDS
Equity Share Capital 10
63
63
63
64
Reserves& Surplus 163
148
166
211
208
Shareholders Funds 174
211
229
275
271
Total Loans 39
45
59
52
66
Deferred Tax Liability -
0
0
0
0
Total Liabilities 213
256
288
327
338
APPLICATION OF FUNDS
Net Block 19
23
57
55
54
Capital Work-in-Progress
3
5
6
11
17
Investments 55
60
45
48
49
Current Assets 184
231
273
322
327
Inventories -
-
-
-
-
Sundry Debtors 131
176
206
239
204
Cash 24
19
24
35
44
Loans & Advances 12
14
18
21
32
Other Assets 17
22
26
27
48
Current liabilities 52
68
101
120
123
Net Current Assets 132
162
172
203
205
Deferred Tax Asset 4
6
9
10
12
Total Assets 213
256
288
327
338
Source: RHP, Angel Research

Newgen Software Technologies Limited | IPO Note
Jan 12, 2018
6
Consolidated Cash Flow Statement
Y/E March (` cr) FY2014
FY2015 FY2016
FY2017
1HFY18
Profit before tax
50
59
34
68
8
Depreciation
4
4
4
5
3
Change in Working Capital (32)
(43)
(20)
(37)
10
Interest / Dividend (Net)
0
(0)
0
0
0
Direct taxes paid (8)
(13)
(17)
(17)
(11)
Others
4
2
9
14
4
Cash Flow from Operations
17
9
11
33
14
(Inc.)/ Dec. in Fixed Assets (6)
(10)
(22)
(10)
(8)
(Inc.)/ Dec. in Investments (53)
1
16
3
1
Cash Flow from Investing (59)
(9)
(6)
(6)
(7)
Issue of Equity (1)
0
0
0
0
Inc./(Dec.) in loans
62
6
14
(3)
15
Dividend Paid (Incl. Tax) (6)
(9)
(12)
(8)
(12)
Interest / Dividend (Net) (1)
(2)
(3)
(4)
(2)
Cash Flow from Financing
53
(6)
(1)
(15)
1
Inc./(Dec.) in Cash
11
(5)
5
11
8
Effect of exch diff on cash
0
(0)
0
(0)
1
Opening Cash balances
13
24
19
24
35
Closing Cash balances
24
19
24
35
44
Source: Company, Angel Research

Newgen Software Technologies Limited | IPO Note
Jan 12, 2018
7
Exhibit 3: Key Ratios
Y/E March FY2014 FY2015 FY2016 FY2017
Valuation Ratio (x)
P/E (on FDEPS) 39.0 34.5 57.6 30.6
P/CEPS 35.9 31.6 49.8 28.0
P/BV 9.2 7.6 7.0 5.8
Dividend yield (%) 0.0 0.0 0.0 0.0
EV/Sales 6.3 5.1 4.6 3.7
EV/EBITDA 32.5 27.1 40.5 22.4
EV / Total Assets 7.3 6.1 5.5 4.8
Per Share Data (Rs)
EPS (Basic) 6.3 7.1 4.3 8.0
EPS (fully diluted) 6.3 7.1 4.3 8.0
Cash EPS 6.8 7.8 4.9 8.8
DPS 0.0 0.0 0.0 0.0
Book Value 26.6 32.3 35.1 42.0
Returns (%)
ROCE 20.9 20.9 12.1 19.9
Angel ROIC (Pre-tax) 33.3 30.1 15.9 26.7
ROE 23.7 21.9 12.1 19.1
Turnover ratios (x)
Inventory / Sales (days) - - - -
Receivables (days) 192 208 216 205
Payables (days) 11 17 16 15
Working capital cycle (ex-
cash) (days)
182 191 201 189
Source: Company, Angel Research

Newgen Software Technologies Limited | IPO Note
Jan 12, 2018
8
Research Team Tel: 022
-
39357800
E
-
mail: research@angelbroking.
com Website:
www.angelbroking.com
DISCLAIMER
Angel Broking Private Limited (hereinafter referred to as “Angel”) is a registered Member of National Stock Exchange of India Limited,
Bombay Stock Exchange Limited and Metropolitan Stock Exchange Limited. It is also registered as a Depository Participant with CDSL
and Portfolio Manager and investment advisor with SEBI. It also has registration with AMFI as a Mutual Fund Distributor. Angel Broking
Private Limited is a registered entity with SEBI for Research Analyst in terms of SEBI (Research Analyst) Regulations, 2014 vide
registration number INH000000164. Angel or its associates has not been debarred/ suspended by SEBI or any other regulatory
authority for accessing /dealing in securities Market. Angel or its associates/analyst has not received any compensation / managed or
co-managed public offering of securities of the company covered by Analyst during the past twelve months.
This document is solely for the personal information of the recipient, and must not be singularly used as the basis of any investment
decision. Nothing in this document should be construed as investment or financial advice. Each recipient of this document should
make such investigations as they deem necessary to arrive at an independent evaluation of an investment in the securities of the
companies referred to in this document (including the merits and risks involved), and should consult their own advisors to determine
the merits and risks of such an investment.
Reports based on technical and derivative analysis center on studying charts of a stock's price movement, outstanding positions and
trading volume, as opposed to focusing on a company's fundamentals and, as such, may not match with a report on a company's
fundamentals. Investors are advised to refer the Fundamental and Technical Research Reports available on our website to evaluate the
contrary view, if any.
The information in this document has been printed on the basis of publicly available information, internal data and other reliable
sources believed to be true, but we do not represent that it is accurate or complete and it should not be relied on as such, as this
document is for general guidance only. Angel Broking Pvt. Limited or any of its affiliates/ group companies shall not be in any way
responsible for any loss or damage that may arise to any person from any inadvertent error in the information contained in this report.
Angel Broking Pvt. Limited has not independently verified all the information contained within this document. Accordingly, we cannot
testify, nor make any representation or warranty, express or implied, to the accuracy, contents or data contained within this document.
While Angel Broking Pvt. Limited endeavors to update on a reasonable basis the information discussed in this material, there may be
regulatory, compliance, or other reasons that prevent us from doing so.
This document is being supplied to you solely for your information, and its contents, information or data may not be reproduced,
redistributed or passed on, directly or indirectly.
Neither Angel Broking Pvt. Limited, nor its directors, employees or affiliates shall be liable for any loss or damage that may arise from
or in connection with the use of this information.